Inventory levels for single and multi-family new infills remain steady while sales continue to steadily decline.
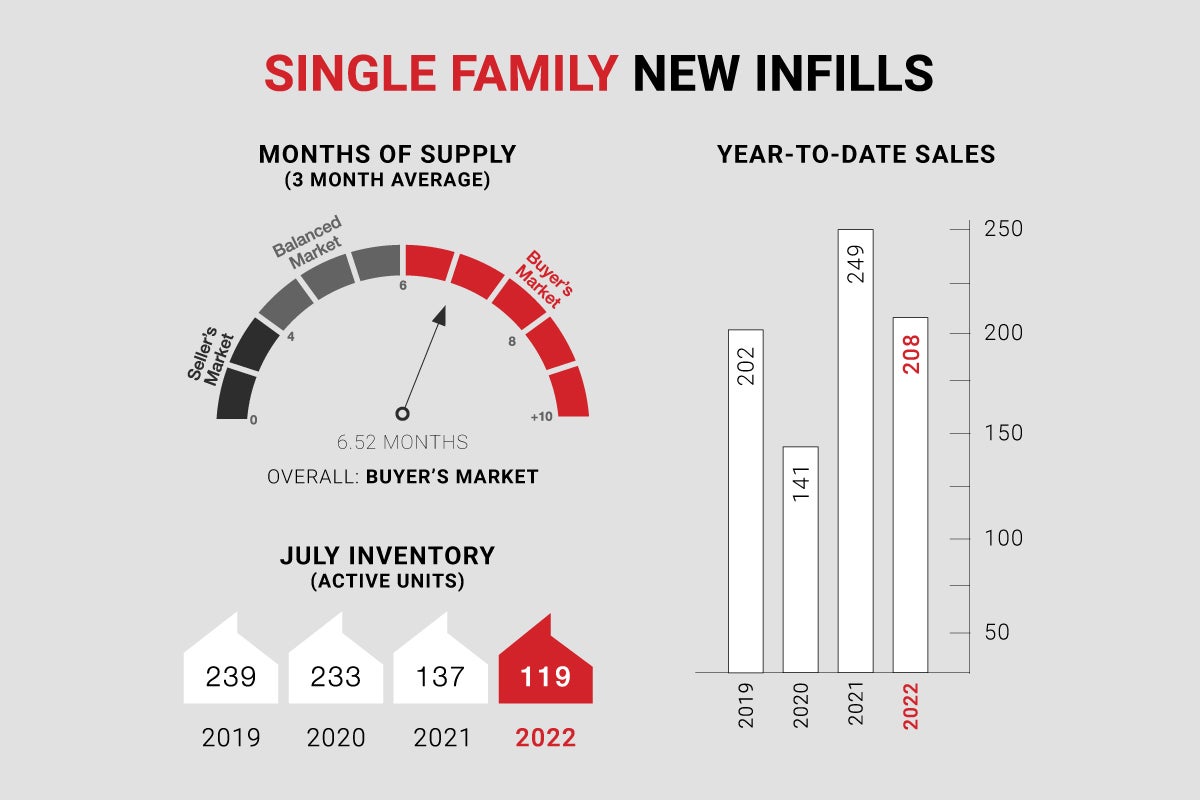
Single-family new infills posted 14 sales during the month of July, down from the 19 sales posted last month and considerably down from the 24 sales recorded in July of last year. Year-to-date single-family sales are sitting at 208, down 16% from the same period in 2021 but up 34% compared to the same period in 2020.
Single-family new infill inventory has declined slightly, to 119 active listings from the 120 active listings recorded last month and down from the 137 active listings recorded at this time last year. Year-to-date average inventory sits at 120 active listings, down 21% compared to 2021 and down 43% compared to 2020.
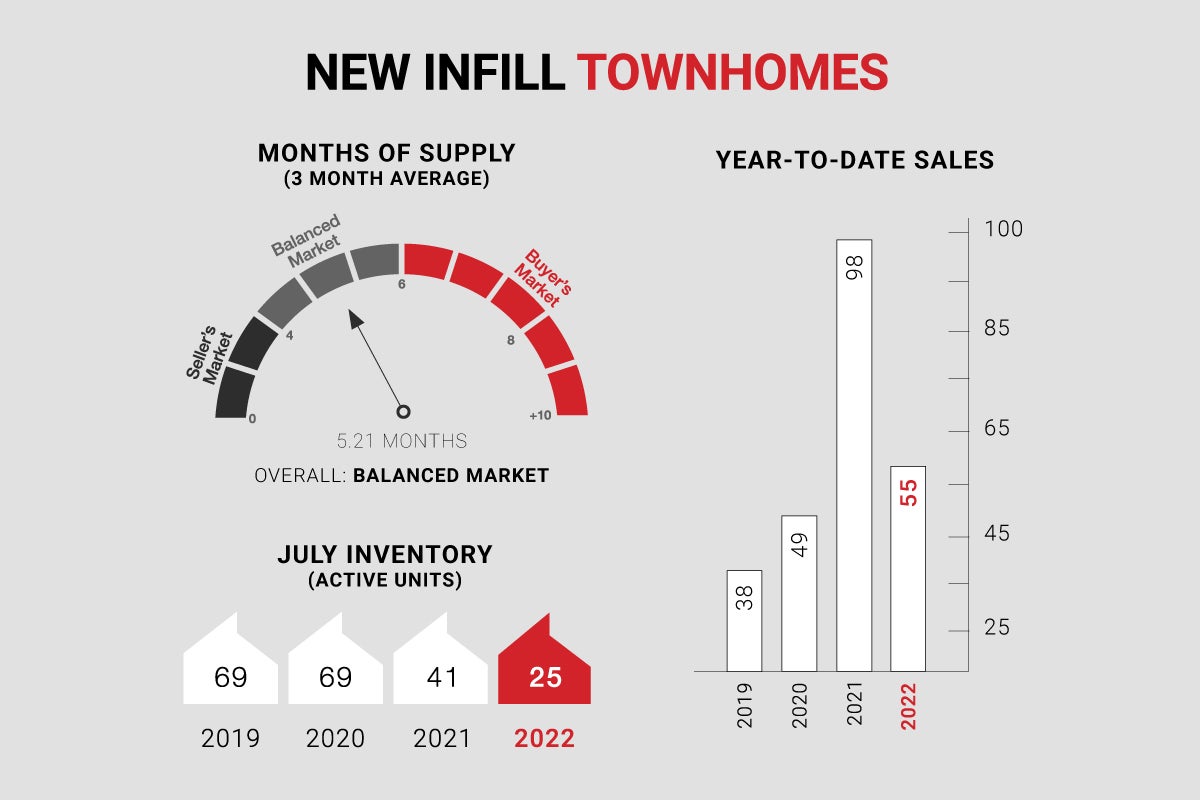
New infill townhomes posted just 2 sales during the month of July, down from 6 sales recorded last month and down from the 5 sales recorded in July of last year. Year-to-date townhome sales sit at 53, down 43% compared to 2021 but up 8% compared to 2020.
New infill townhome inventory is on-par with last month, with 25 active units for sale, but down from the 41 active units recorded at this time last year. Year-to-date average townhome inventory sits at 23, down 56% compared to 2021 and down 63% compared to 2020.
Although the recent significant interest rate hike has eased sales activity, inventories remain low, which has led to prices remaining stable. With the next interest rate announcement coming in September, rates are expected to rise further, which should put further downwards pressure on sales activity.


CALGARY MARKET UPDATE (CREB)
City of Calgary, August 2, 2022 - Significant slowdowns in the detached and semi-detached market were nearly offset by sales growth in the apartment and row sectors. This left July sales three per cent lower than levels recorded last year. While this is the second month where sales activity has slowed, total residential sales this month are still amongst the strongest levels recorded in our market.
“Rising lending rates are causing shifts within the market and, as a result, new listings for higher-priced product are on the rise relative to sales activity,” said CREB® Chief Economist Ann-Marie Lurie.
“Meanwhile, there continues to be a lack of supply for lower-priced detached and semi-detached product. This is driving consumers who are looking for affordable homes to purchase apartment- and row-style properties.”
Residential new listings in the city declined compared to what was seen in 2021, but when considering the dynamics between price ranges, we are seeing a different trend play out. Listings for homes priced below $500,000 fell by 18 per cent, while levels rose by 20 per cent for homes priced above $500,000. This has left conditions to remain relatively tight in the lower-end of the market while conditions are shifting toward more balanced levels in the upper-end of the market.
When considering the relationship between the supply and demand, the months of supply has continued to trend up from the exceptionally tight conditions seen earlier in the year. However, with just over two months of supply, the market remains far tighter than anything experienced throughout the recessionary period experienced prior to the pandemic.
As expected, the benchmark price did see some slippage relative to levels seen earlier in the year and rising lending rates have cooled much of the bidding war activity that was driving significant gains earlier in the year. However, prices currently remain over 12 per cent higher than last year’s levels, still outpacing forecasted price growth for the year.
“As we move forward, we do anticipate further rate gains will weigh on housing activity and prices, but not enough to completely offset the exceptionally strong gains recorded over the first half of the year,” said CREB® Chief Economist Ann-Marie Lurie.